ISO 9001 review
 ISO 9001 review is currently being undertaken by ISO/TC176, the umbrella ISO committee for quality management and assurance. The committee draft will be issued in anytime now with drafts for comment published in the second half of 2007 with publication of the revised standard planned for late 2008. The key messages coming out of the process to date are that:
- the current scope and purpose of the standard, the title and the field of application shall remain unchanged from ISO 9001:2000
- given that the current standard was a step change from its predecessor and caused considerable changes to businesses, changes will be limited in this review
- it will remain generic so that it can be applied to all types and sizes of organisation. This one-size-fits-all approach will see the continued growth of sector-specific requirements and schemes
- any changes introduced must provide clear benefits to users
- the quality management principles (as contained in ISO 9000) shall be applied unchanged
- the process model, as shown in ISO 9001:2000 figure 1 below, shall remain unchanged
 I’m led to believe that some of the changes are:
- clause 1.2 – clarify the intent of this clause in relation to when exclusions can be made in clause 7 specifically for service organisations
- clause 5 – consider clarification of application of the process approach to top management
- clause 5.4.2 – consider the clarification of quality management system planning in order to meet the quality objectives
- clause 8.2.1 – clarify the requirement for client perception (monitoring versus measurement)
- clause 8.3 – clarify this clause in relation to service organisations
- clause 8.5 – clarify the differences in concepts between corrective action and preventive action
 There has been global growth in certification of 18 per cent across 161 countries.
The top five countries for ISO 9001 certification are:
- China (143,823)
- Italy (98,028)
- Japan (53,771)
- Spain (47,445)
- UK (45,612)
with India seeing the largest growth of over 12,000 a year.
Technorati Tags: six sigma, lean manufacturing

8 steps to lean six-sigma culture change

Hmm, I’m not sure I agree with this post:
given that Lean/Six Sigma/Concurrent Design are really just a bag of tools from which a skilled mechanic will draw out one that is appropriate
Or even understand this post (perhaps one of my readers can translate this into English).
But I will agree that of course there are tools which are used in lean and six sigma, but you have to get into the philosophy behind lean and six sigma. Pulling tools out of a bag is great and WILL cause improvements to happen but sustainable long-term change will not occur unless driven by top management, who are committed to culture change.
The other problem with just using tools is you tend to get stuck in the Analysis phase. Too much analysis is a bad thing, for example, “the Economic analysis of leaving the toilet seat down“:
the social norm of leaving the toilet seat down in inefficient in the sense that it does not minimize the total cost of toilet seat operations per household. However, both papers fail to address an important concern: If a female finds the toilet seat in a wrong position then she will most probably yell at the male involved. This yelling inflicts a cost on the male. Based on this omission, women may argue that the analysis in these papers is suspect.
 So, follow these eight steps to making culture change a reality:
- Capitalize on Propitious Moments (for example poor financial performance, making sure people actually perceive the need for change)
- Combine Caution with Optimism (create an optimistic outlook on what the change effort will bring)
- Understand Resistance to Culture Change (both at the individual level [fear of the unknown, self-interest, selective attention and retention, habit, dependence, need for security] and at the organizational or group level [threats to power and influence, lack of trust, different perceptions and goals, social disruption, resource limitations, fixed investments, interorganizational agreements]
- Change Many Elements, But Maintain Some Continuity (for example identify the principles that will remain constant) -also consider reorganising the quality function
- Recognize the Importance of Implementation (initial acceptance and enthusiasm are insufficient to carry change forward; a) adoption –> b) implementation –> c) institutionalization)
- Select, Modify, and Create Appropriate Cultural Forms (employing symbols, rituals, languages, stories, myths, metaphors, rites, ceremonies)
- Modify Socialization Tactics (because the primary way that people learn the corporate culture is through the socialization process at the beginning of their employment, if these socialization processes are changed, an organization’s culture will begin to change)
- Find and Cultivate Innovative Leadership (members are unlikely to give up whatever security they derive from existing cultures and follow a leader in new directions unless that leader exudes self-confidence, has strong convictions, a dominant personality, and can preach the new vision with drama and eloquence)
Technorati Tags: six sigma, lean manufacturing
BPM Battles Six Sigma
 Ting! There goes the bell. If you put Business Process Management (BPM) and six sigma in a boxing match, who would you place your money on? Well for a somewhat biased account (towards BPM), download a free pdf to read the full blow-by-blow report, but if you’re in a hurry (apparently):
BPM is about the management of process improvement and ensuring that it is made sustainable within the organisation. It is about the establishment of a business process architecture, process governance, organisational change management capability, sustainable process performance and increasing BPM maturity, to name but a few. Whereas, Six Sigma can be a useful intervention strategy for a business process improvement problem. Therefore, we would see Six Sigma as a potential useful adjunct to BPM.
Hmm, while I see BPM as being able to allow firms to fine tune their processes and possibly make a businesses’ internal processes function more productively I agree with this comment:
Typically it (BPM) refers to the identification of core business processes, assignment of process ownership and definition of measures (and perhaps benchmarks) that indicate the health of a particular process. These measures are often influential in selection of Six Sigma or Lean projects.
What do you think?
Technorati Tags: six sigma, lean manufacturing
Global Barriers to Lean Understanding
 We all know that lean and six sigma cuts waste and boosts productivity but an essential “tool” which is often overlooked in these projects is effective communication. And no where is it required more if project teams don’t speak English as a first language.
Generally, if we want a successful outcome when you’re crossing international boundaries:
good quality means that the target audience received the message its provider intended it to receive.
This communication issue manifests itself in global sourcing. However, even though: you should obtain parts locally, as close to your plant as possible, to eliminate the waste of transportation firms are increasingly:
- exploiting global efficiencies in production
- identifying alternate supplier sources
- utilizing buffer capacities and
- taking advantage of specific geographical talent pools.
China dominates the global sourcing directions of most firms, particularly for those based in the United States and Europe. However, near-shore sourcing destinations such as South America and Eastern Europe form significant second-tier markets.
Indeed, research has shown that a low-cost country sourcing can have a positive impact on company performance in terms of cost and quality although the time dimension remains to be a challenge.
So, whether or not a local or global supply base makes sense is really up to the company, customer and market sector involved. I believe there should be as a minimum three supply base goals:
- quality improvement to Six Sigma levels
- delivery performance measured zero days late, to one day early
- total cost of ownership improvement.
Also you don’t want improvements to come at the expense of supplier margins. The supply base needs to make reasonable margins in order to remain healthy, commercially viable suppliers. Supply chain management is meant to reduce excess inventory in the supply chain. A supply chain should be demand driven. It is built on the pull approach of customers pulling inventory, not with suppliers pushing inventory. Excess inventory reflects the additional time with the supply chain operation. So the perfect supply chain would be lean with removing wasteful time and inventory regardless of where it is in the world.
What do you think? Can a global supply chain be lean?
Technorati Tags: six sigma, lean manufacturing
Kano model
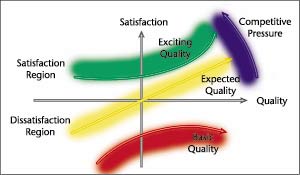
The Kano model is a theory of product development developed in the 80’s by Professor Noriaki Kano which classifies customer preferences into five categories:
- Attractive quality: Attractive quality attributes can be described as surprise and delight attributes; they provide satisfaction when achieved fully, but do not cause dissatisfaction when not fulfilled. These are attributes that are not normally expected, for example, a thermometer on a package of milk showing the temperature of the milk. Since these types of quality attributes often unexpectedly delight customers, they are often unspoken. An example of this is W. Edwards Deming’s statement: “The customer never asked Mr. Edison for a light bulb”. As a six sigma practitioner do you emphasise the importance of attractive quality creation since? Often this dimension is neglected as there is a tendency to focus on how to eliminate things gone wrong.
- One-dimensional quality: One-dimensional quality attributes result in satisfaction when fulfilled and dissatisfaction when not fulfilled. These attributes are spoken and are those with which companies compete. For example, a new milk package that is said to contain 10 percent more milk for the same price is likely to result in customer satisfaction, but if it actually only contains 6 percent more milk, it is likely that the customer will feel misled, which results in dissatisfaction.
- Must-be quality: Must-be quality attributes are taken for granted when fulfilled but result in dissatisfaction when not fulfilled. In the milk example, these attributes can be represented by leakage. Customers are dissatisfied when the package leaks, but when it does not leak the result is not increased customer satisfaction. Since customers expect these attributes and views them as basic, it is unlikely that they are going to tell the company about them when asked about quality attributes.
- Indifferent quality: Indifferent quality refers to aspects that are neither good nor bad, and, consequently, they do not result in either customer satisfaction or customer dissatisfaction.
- Reverse quality: Reverse quality refers to a high degree of achievement resulting in dissatisfaction (and vice versa, a low degree of achievement resulting in satisfaction) and to the fact that not all customers are alike. For example, some customers prefer high-tech products, while others prefer the basic model of a product and will be dissatisfied if a product has too many extra features.
Application of the Kano Model Analysis
A simple approach to applying the Kano Model Analysis is to ask customers two simple questions for each attribute:
1. Rate your satisfaction if the product has this attribute?; and
2. Rate your satisfaction if the product did not have this attribute?
Customers should be asked to answer with one of the following responses:
A) Satisfied;
B) Neutral (Its normally that way);
C) Dissatisfied;
D) Don’t care.
Basic attributes generally receive the “Neutral” response to Question 1 and the “Dissatisfied” response to Question 2. Exclusion of these attributes in the product has the potential to severely impact the success of the product in the marketplace.
Eliminate or include performance or excitement attributes that their presence or absence respectively lead to customer dissatisfaction. This often requires a trade-off analysis against cost. As Customers frequently rate most attributes or functionality as important, asking the question “How much extra would you be willing to pay for this attribute or more of this attribute?” will aid in trade-off decisions, especially for performance attributes. Prioritisation matrices can be useful in determining which excitement attributes would provide the greatest returns on Customer satisfaction.
Consideration should be given to attributes receiving a “Don’t care” response as they will not increase customer satisfaction nor motivate the customer to pay an increased price for the product. However, do not immediately dismiss these attributes if they play a critical role to the product functionality or are necessary for other reasons than to satisfy the customer.
The information obtained from the Kano Model Analysis, specifically regarding performance and excitement attributes, provides valuable input for the Quality Function Deployment process.
Technorati Tags: six sigma, lean manufacturing
San-Gen Shugi
This article in the Harvard Business Review looks at how staff are trained in the Toyota Production System (TPS) to make improvements in the production process. The article picks out some of the key differences between TPS and the way most American and European enterprises tackle productivity improvement. I’ll focus on two points:
- There is no substitute for direct observation.
Many western employees try to solve problems (for example, why a machine is unreliable) by thinking about the problem and devising hypotheses that can can checked. Toyota gets their employees to recognise the importance of direct observation. - Managers should coach, not fix.
Each worker looks for ways to improve the process, and the manager’s role becomes one of involving the team in identifying the problems and not doing all the work himself
The TPS lends itself to Deming’s writings about Leadership who understood that traditional supervisory activities are reactive rather than proactive. Many managers to pay a great deal of attention to reports and data which tell them what happened yesterday, last week, last month, or last year. Often such reports highlight the things that have gone wrong. Deming has compared this to attempting to drive a car by looking only in the rear-view mirror. Because of this, he observed that, “A supervisor is an auditor of failure, while a leader listens and learns, studies and understands and works to improve the system.” He also noted that “One important characteristic of a leader is that he will forgive a mistake – there will be mistakes.”
The Toyota Way: 14 Management Principles from the World’s Greatest Manufacturer book elaborates on these points using the principle of Genchi Genbutsu (現地現物) which means “Go and see for yourself” or San Gen Shugi ‘Three Reals Philosophy’:
- Genba: the real place – ‘the actual spot’; ‘the precise location’; ‘the place where the action is’ i.e. the shopfloor, in a manufacturing plant, or ‘the workplace’.
- Genbutsu: the real thing – look at the real part or the real service provided (whether good or bad) and analyze it while focusing on the facts
- Genjitsu: realistic action – speak with data for a better understanding
The graphic below provides an outline of this principle (image credit)
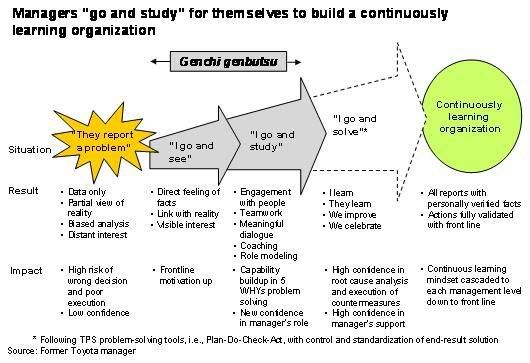
click the image for a large version
Is this more effective method than simply reading a report?
Technorati Tags: six sigma, lean manufacturing
Muda is evil and must die
 Muda is any human activity which absorbs resources but creates no value. Its elimination is what lean manufacturing is all about and it is one of the most effective ways to increase the profitability of any business. Look at each step in each process: the step either add value or they don’t. A process adds value by producing goods or providing a service. A process also consumes resources. Waste occurs when more resources are consumed than are necessary to produce the goods or provide the service.
-
Specifically seven types of wastes are normally quoted. These were originally developed by Toyota’s Chief Engineer Taiichi Ohno as the core of the Toyota Production System. The trick is to look at a process or work-place through “muda glasses” (look on page 10 of this excellent free pdf file for more information). Once you put these on you should be able to see the following:
- Over-production: Producing more than necessary results in consumption of raw materials before they are needed; wasteful use of manpower and utilities; additions of machinery; increased interest burdens; increased inventory (below); increased transportation and admin costs.
- Inventory or Work-in-Progress (WIP): Final products, work in progress, parts and supplies all add to the cost of operations by consuming space, facilities, manpower and admin. Their quality also deteriorates over time, and they may even be destroyed by a fire or other disaster.
- Transportation: Moving materials or products adds no value. Worse, damage often occurs during transport.
- Repair / Rejects: Rejects interrupt production and require expensive rework. Often the rejects must be discarded, thus wasting the resources and effort that went into their creation. The rejects themselves may also damage machinery.
- Motion: Any motion of a person’s body not directly related to adding value is unproductive. Unnecessary or awkward operator motions put undue stress on the body and cause waste.
- Over-processing: Sometimes inadequate technology or design leads to muda in the processing work itself. For example, the apparent need to wrap WIP in bubble-wrap for transportation to another machine could be eliminated by re-designing the assembly line.
- Waiting: Waiting occurs when the hands of the operator are idle; when an operator’s work is put on hold because of line imbalances, lack of parts or machine downtime; or when the operator is simply monitoring the machine as it adds value.
Simplified view of muda is:
- Wasting time.
- Wasting a consumable resource, such as materials.
- Causing dissatisfaction (including incomplete satisfaction).
Muda is one of the ‘3Ms’: muda, or waste, mura, meaning irregular, uneven or inconsistent, and muri, meaning unreasonable or excessive strain. Basically, Muda is the waste in a process; these are the seven production wastes that Taiichi Ohno references. Transportation, Inventory, Movement, Waiting, Overproduction, Over-processing, and Defects; Mura is the unevenness or fluctuation of the schedule: Variability; and Muri is the overburdening of your people or equipment.
Curious Cat also has a good article on muda here and so does the lean six-sigma academy here.
Technorati Tags: six sigma, lean manufacturing
The super-quick guide to Lean Manufacturing
 The Lean philosophy was developed by Toyota in the 1950s and 1960s to improve the efficiency of car production. It was used to ensure the 10,000 components of a car were ready at the right time of the production line to allow the fastest possible production of motor vehicles. Lean encourages managers to look at how customers and goods flow through their systems to unlock bottlenecks and inefficiencies. In doing so it defines value-adding activity solely as those which affect the customer and estimates 90% of all actions within organisations are wasted because they add no value. The principles have been adopted by organisations as diverse as Tesco and the NHS.
Lean manufacturing refers to the systematic identification and elimination of waste (muda) from a process while increasing responsiveness to change. While there are a number of specific tools that organizations use to implement lean production systems, the six core methods listed below are most typically used. Most of these lean methods are interrelated and some can occur concurrently. Implementation is often sequenced in the order presented below. Most organizations begin by implementing lean techniques in a particular production area or at a pilot facility and then expand use of the methods over time.
- Kaizen
- 5S
- Total Productive Maintenance (TPM)
- Cellular Manufacturing / One-piece Flow Production Systems
- Just-in-time Production / Kanban
- Six Sigma
Other tools such as value stream mapping (click here to download a file from my website) can also be deployed.
Click here for a typical lean production implementation roadmap.
Technorati Tags: six sigma, lean manufacturing
The Ultimate Short Guide to Value Stream Mapping
 A value stream map is a simple diagram of every step involved in the material and information flows needed to bring a product from order to delivery. The first step is to draw a visual representation of every step in a process, including key data, such as the customer demand rate, quality, and machine reliability. Next, draw an improved future-state map showing how the product or service could flow if the steps that add no value were eliminated. Finally, create and implement a plan for achieving the future state.
It’s important to make the distinction between process mapping and value stream mapping as the two are not the same. What makes value stream mapping different? On a value stream map you get both the material and information flow. By doing this we can see the relationship between these two flows and it allows us to understand where the sources of waste actually are.
A consideration of cycle time is critical. Cycle time is the total elapsed time to move a unit of work from the beginning to the end of a physical process. However, the overall cycle time may include non-value added tasks which do not add value to the end result; this is known as muda or waste.
The key to mapping a value stream is flexibility. Although there are many excellent books such as:
- Learning to See: Value Stream Mapping to Add Value and Eliminate Muda
- Creating Continuous Flow: An Action Guide for Managers, Engineers and Production Associates
- Making Materials Flow: A Lean Material-Handling Guide for Operations, Production-Control, and Engineering Professionals
- Seeing the Whole: Mapping the Extended Value Stream
you should always be prepared to amend the tools to fit your company. Initially, it will be difficult to do this but you will end-up with a set of mapping icons and methodology which is specific to the way your company operates.
Value Stream Mapping Process Step Templates/Symbols
Here are some templates and symbols you can use for tracking your value stream map tasks:
- Value Stream Map Process Step Templates: Excel, PDF
- Value Stream Map Symbols: VSM symbols #1, VSM symbols #2
Technorati Tags: six sigma, lean manufacturing
One sample z-test using Minitab
 Using an example from The Practice of Business Statistics Minitab Manual
 I’ll illustrate the basics of the one sample z-test using Minitab.
A manufacturer of pharmaceutical products. The laboratory verifies the concentration of active ingredients by analysing each specimen three times. The standard deviation of this distribution is known to be σ = 0.0068 grams per litre. Three analyses of one specimen give concentrations: 0.8403, 0.8363, 0.8447.
One-Sample z-Test
A hypothesis test for a population mean μ, with σ known, can be undertaken by selecting:
Stat > Basic Statistics > 1-Sample Z
from the menu. In the dialogue box, enter the column containing the variable that you want to calculate the hypothesis test for and enter a value for σ in the Sigma box. In the Test mean box, specify the null hypothesis test value.
In this example, we want to determine if there is significant evidence at the 1% level that the true concentration is not 0.86%. This calls for a test of the hypothesis that μ = 0.86 against the alternative μ ≠ 0.86.
Click on the Options button. In the Options sub-dialogue box, specify the alternative hypothesis. You can choose less than (lower-tailed), not equal (two-tailed), or greater than (upper-tailed) and click OK.
If instead we wish to test the hypothesis that μ = 0.86 against the alternative μ. The P-value given is always smaller for the one-sided test. In fact, it is equal to half the P-value computed for the two-sided test. In both tests, the P-value is 0 and the null hypothesis should be rejected.
Related Resources:
- Wikipedia entry
- A nice worksheet of the main concepts (doc file)
- Another useful overview (pdf file)
Technorati Tags: six sigma, lean manufacturing
About
Blog objectives
This blog is about quality assurance, six sigma and the Toyota Production System. Hopefully you’ll gain a deeper understanding of this subject by reading the articles, conversations, images, links, thoughts and video clips I post regularly?
About me
I sometimes post comments on other blogs:
You can view my LinkedIn profile and online resume by clicking here:
![]()
I’m an engineer and manager by education; quality, safety and environmental professional by experience and statistical enthusiast out of necessity. I believe that although it is easy to lie with statistics it is hard to tell the truth without them. I hold a Bachelor of Engineering (Hons) degree from the University of Northumbria, a Master of Science degree in Total Quality Safety & Environmental Management from the Open University & a Master of Business Administration degree from the University of Durham along with several other qualifications.
After completing a mechanical and production engineering apprenticeship with a turbine-generator manufacturer, I moved into planning for the offshore industry, followed by a move into quality for a consulting firm which specialised in the turnkey construction of combined cycle gas turbine power stations across Europe. Next I helped to establish a high-volume electronics company as a manager responsible for all aspects of quality, safety and environmental issues and then finally to a filter manufacturing company in NE England.
I am a European Foundation For Quality Management Business Excellence Assessor, Six Sigma Black Belt, Member of the Chartered Institute of Quality Assurance, Institute of Occupational Safety and Health, Senior Member of the American Society for Quality, Lead Environmental and Quality Systems Assessor and also a Member of the Chartered Institute of Management.
My favourite work related quote comes from Sir Henry Royce (1863-1933) :
“Strive for perfection in everything you do. Take the best that exists & make it better. If it doesn’t exist create it. Accept nothing as nearly right or good enough”.
Disclaimer
Come on guys …. please take everything I say in the spirit it’s intended. I’m not offering professional advice just my personal opinions – you can take them or leave them! The quality profession is a journey and as such my thoughts and opinions change from time to time as I come to learn more and develop my understanding about the things and issues that I am blogging about. This blog just provides a snapshot of the knowledge, views, and opinions that I hold at a particular point of time and these might most probably change over a period of time.
I reserve the right to evolve my knowledge, thoughts, and viewpoints over time and to change them without assigning any reason. My blog includes links to other sites/blogs operated by third parties. These are provided as a means of convenient access to you to the information/opinion contained therein. I am in no way responsible for the content of any other sites or any products or services that may be offered through other sites. The information in this weblog is provided “AS IS” with no warranties, and confers no rights.
This weblog does not represent the thoughts, intentions, plans or strategies of my employer. Feel free to challenge me, disagree with me, or tell me I’m completely nuts in the comments section of each blog entry, but I reserve the right to delete any comment for any reason whatsoever (abusive, profane, rude, or anonymous comments) – so keep it polite, please!
Remember: Taking Ex-Lax and sleeping tablets on the same night is rarely a good idea.

Feed subscription
Technorati Faves

 Subscribe to my cocomment feed
- An error has occurred; the feed is probably down. Try again later.

